Analyzing PIO Blink Using Logic Analyzer on Raspberry Pi Pico with Embedded Rust
In this post, we use a logic analyzer to study a GPIO signal generated by a PIO state machine on the RP2040. We derive the timing from instruction cycles and validate it on real hardware with Embedded Rust. In earlier posts, we used a logic analyzer to inspect simple GPIO signals and UART communication. In this post, we will use the logic analyzer to inspect a signal generated by PIO, which is specific to the Raspberry Pi Pico variants (RP2040 and RP2350 chips). If you do not know what PIO is, I recommend checking the introduction in the “impl Rust for RP2040” book. I will still give a short overview here so that we are all on the same page before looking at logic analyzer captures. PIO, short for Programmable I/O, is a hardware block available on RP2040 and RP2350 microcontrollers. It allows us to write small programs that run independently of the main CPU and directly control GPIO pins. Each PIO block contains a few state machines. A state machine executes instructions from a small instruction memory, one instruction at a time, and can drive pins, sample pins, and move data in and out through FIFOs. The important part for this post is that PIO timing is instruction-driven. Unlike CPU code, where timing depends on compiler output, interrupts, and scheduling, PIO timing is deterministic. Each instruction takes a known number of cycles to execute. Each PIO state machine has its own clock divider. This divider controls how fast instructions are executed. On RP2040, the PIO instruction clock is derived from the system clock like this: In our setup: So the instruction execution rate becomes: This means the PIO state machine executes roughly 1.9 thousand instructions per second. By default, every PIO instruction takes exactly one instruction cycle to execute. PIO also supports an instruction delay modifier, written using square brackets. For example: This means: So the total execution time for that instruction is 32 instruction cycles. Since we know the instruction execution rate, we can compute the time taken by one instruction cycle. With a clock divider of 65535: That means approximately: You can clone the project used in this post from the following repository: This project contains the exact PIO program and Embassy setup used for the logic analyzer measurements shown in this post. This is the PIO assembly program used to generate the blinking signal that we will analyze with the logic analyzer. This program runs in an infinite loop and drives a single GPIO pin HIGH and LOW. The delays are added using the instruction delay modifier. Each instruction with [31] takes a total of 32 PIO cycles to execute. The one place where [30] is used is intentional. The jmp loop instruction takes one extra cycle while the pin is LOW, so reducing the delay on Because the program timing is entirely instruction-based, we can predict the exact HIGH time, LOW time, and output frequency before even connecting the logic analyzer. The hardware setup is very simple. We connect the logic analyzer to the same GPIO pin that drives the LED, so we can observe exactly what the LED sees. The external LED is connected to GPIO15 through a resistor. The logic analyzer channel is connected in parallel to the same GPIO pin. With this setup, the GPIO pin drives both the LED and the logic analyzer input at the same time. The LED gives us a visual confirmation of the blinking, while the logic analyzer lets us inspect the exact timing and waveform. Make sure the logic analyzer ground and the Pico ground are connected. Without a common ground, the captured signal will be unreliable. Open PulseView as usual. For this capture, I have configured the sample rate to 20 kHz and the number of samples to 1 million. Once the settings are in place, click Run to start the capture. PulseView will record the signal and automatically stop once it reaches the configured number of samples. Up to this point, we have been looking at captured waveforms mainly to understand their overall shape and behavior. To measure timing more precisely, PulseView provides a cursor feature that is very useful. When you enable This makes it easy to measure how long a signal stays HIGH, how long it stays LOW, or the full period of a repeating waveform. With the capture complete, we can now use the cursors to measure the actual timing of the signal generated by PIO. In the capture above, the cursors are placed across one full HIGH-LOW cycle of the waveform. PulseView directly shows the measured period as roughly 268 ms, which corresponds to a frequency of about 3.7 Hz. To understand why the measured period comes out to around 268 ms, let us now work through the timing of the PIO program step by step. The pin goes HIGH when the While the pin is HIGH, the following instructions run: So the total number of instruction cycles while the pin is HIGH is: With each instruction cycle taking about 0.524 ms, the total HIGH time becomes: The LOW phase starts when While the pin is LOW, the following instructions run: So the total number of instruction cycles while the pin is LOW is: This again gives: From the instruction count, we end up with: This matches approximately what we measured using the logic analyzer. PIO
PIO Clock Divider
Instruction Cycles and Delays
Time Per Instruction
Project Source Code
Pio Program
let prg = pio_asm!;
set pins, 0 keeps the HIGH and LOW durations equal. Hardware Setup
Source Connected To GPIO15 Resistor => LED => GND Logic Analyzer CH1 GPIO15 Logic Analyzer GND Pico GND Start the Capture
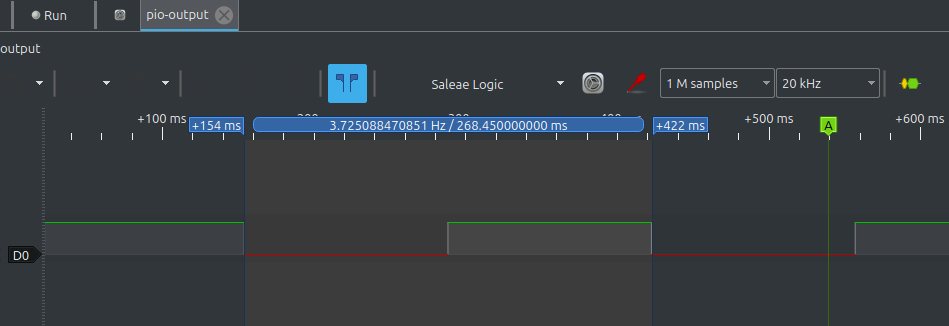
Measuring Timing with Cursors in PulseView
Show Cursors in PulseView, two movable time markers appear on the waveform. Each cursor represents a specific point in time on the capture. By placing the cursors on two edges or points of interest, PulseView shows the exact time difference between them. Verifying the Timing on the Logic Analyzer
High Phase Timing
set pins, 1 instruction executes and stays HIGH until set pins, 0 executes.set pins, 1 [31]
The instruction itself takes 1 cycle, and the delay adds 31 more cycles.
Total: 32 cyclesnop [31] repeated 7 times
Each nop [31] takes 32 cycles.
Total: 7 x 32 = 224 cycles
Low Phase Timing
set pins, 0 executes and lasts until the program loops back and sets the pin HIGH again.set pins, 0 [30]
The instruction itself takes 1 cycle, and the delay adds 30 more cycles.
Total: 31 cyclesnop [31] repeated 7 times
Total: 7 x 32 = 224 cyclesjmp loop
This instruction takes 1 cycle
Putting It All Together