How to Use a Logic Analyzer in Embedded Rust Projects
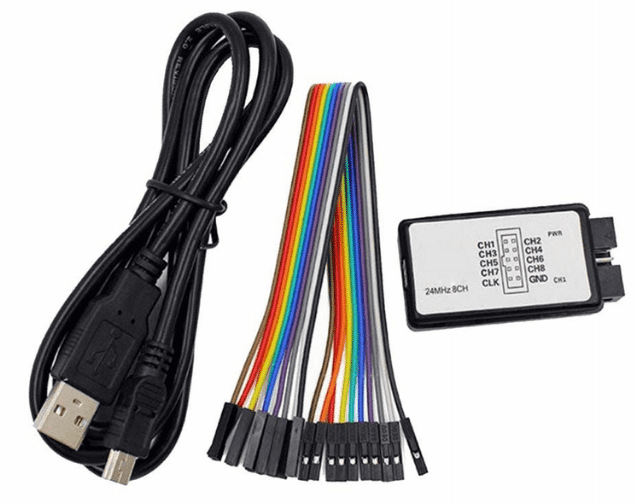
In this post, we take a practical look at using a logic analyzer when working on embedded Rust projects. We cover what a logic analyzer does, how to interpret captured signals, and how it can be used to debug common protocols like I2C, SPI, and UART. I am a hobbyist embedded Rust developer. While researching and learning, I often came across people using oscilloscopes to analyze signals. I might have used one during my college lab days, but honestly, I do not remember much about it anymore. It has been a long time. I was curious to try one again, but I did not want a large oscilloscope sitting on my desk. At least for now, it felt unnecessary. At some point, while looking for simpler ways to inspect digital signals, I came across USB logic analyzers. I do not remember exactly where I first saw one, but it immediately felt like a practical alternative. They are small, inexpensive, and much easier to keep around. There are already plenty of tutorials and videos showing how to use logic analyzers, mostly with Arduino-based examples that you can follow step by step. I decided to write this post for my usual reason: the more I write and explain something, the more I understand it myself. Hopefully, you will find it useful too. The Rust code is only a small part of this blog post. Most of the content focuses on understanding the logic analyzer, setting up the software, and learning how to capture and analyze digital signals. A logic analyzer is a tool used to capture and inspect digital signals. It records whether a signal is in a logical HIGH or LOW state over time and how different signal lines, such as clock and data wires, relate to each other during communication. For embedded development, this is especially useful when working with digital protocols such as I2C, SPI, or UART. Instead of relying on assumptions or print-based debugging, a logic analyzer lets you inspect the actual signal behavior on the wire. Unlike an oscilloscope, which focuses on the exact voltage shape of a signal, a logic analyzer treats signals as digital values. It does not care about the precise voltage level or waveform details, only whether the signal is interpreted as a zero or a one. For most protocol-level debugging, this level of detail is sufficient and much easier to work with. The logic analyzer I am using is a small 8-channel USB logic analyzer with a maximum sampling frequency of 24 MHz. You should be able to find one on online marketplaces for under 400 INR (under $10). As the name implies, the analyzer allows capturing up to eight digital signals at the same time, which makes it possible to observe how multiple related signals change together. A logic analyzer repeatedly checks the state of each connected signal and records whether it is HIGH or LOW. These checks happen at regular intervals, based on the selected sampling rate(will see it later). The logic analyzer itself does not understand protocols or signal meaning. It only records state changes. Interpreting those changes and decoding protocols is done later using software on the computer. A logic analyzer has multiple input channels. Each channel is a separate input that can be connected to a signal wire or a microcontroller pin. When the analyzer captures data, it records the state of each channel independently. When connecting the analyzer, each channel should be connected to one signal of interest, such as a data line or a clock line. The exact choice of signals depends on what you are trying to observe. For now, the important point is that each channel corresponds to one physical wire or pin. I am on Linux, so I will describe the setup steps for Linux here. If you are using a different operating system, you can follow similar steps using the appropriate tools and packages for your OS. There are two commonly mentioned software options when working with USB logic analyzers. Which one makes sense depends on the hardware you are using. For inexpensive 8-channel USB logic analyzers like the one I am using, the most practical software is PulseView, which is part of the open-source sigrok project. PulseView supports many generic logic analyzers and provides the basic tools needed to view captured signals and decode common digital protocols. On Debian or Ubuntu-based systems, you can install PulseView using the package manager: Official documentation for sigrok and PulseView is available here: https://sigrok.org/wiki/Main_Page You can also refer to the PulseView user manual for more details: https://sigrok.org/doc/pulseview/unstable/manual.html I will be using PulseView throughout this blog post. Saleae provides software specifically designed for their logic analyzers, though it may also work with some compatible devices. You can download the Linux AppImage from the Saleae website: https://www.saleae.com/downloads/ Make it executable and run: Let’s start by generating a very simple test signal by toggling a GPIO pin. This helps confirm that the logic analyzer, software, and wiring are all working correctly before moving on to more complex signals. I will be using a Raspberry Pi Pico here, but any other board will work. We will flash a small program that toggles a GPIO pin between high and low states with a delay of 500 milliseconds. For the HAL, I will be using Embassy. You are free to use any other HAL, such as rp-hal. The choice of HAL does not matter here, as long as you can toggle a GPIO pin at a known interval and observe the change on the logic analyzer. If you are not familiar with creating a project or flashing embedded Rust code onto a board, you may want to go through the basics first. I recommend starting with the Pico Pico book or the impl Rust for ESP32 book. First, connect the ground wire of the logic analyzer to one of the ground pins on the Raspberry Pi Pico. The logic analyzer and the Pico must share a common ground for the signals to be interpreted correctly. Next, connect one channel (lets say CH1) of the logic analyzer to GPIO15 on the Pico. For this test, I am using GPIO15, but you can use any other GPIO pin. Power the Pico, then connect the logic analyzer to the computer. Now lets open PulseView and make sure the logic analyzer is detected correctly. Start PulseView after connecting the logic analyzer to your computer. When PulseView opens, it should automatically try to detect connected devices. If the logic analyzer is detected, you should see it selected as the active device in the toolbar. If no device is selected, open the device selection menu and choose the generic logic analyzer entry, which usually appears as fx2lafw (generic driver). Once selected, PulseView should show the available channels for that device. Once the logic analyzer is detected in PulseView, the next step is to configure how data will be captured. Two important settings here are the “sample rate” and the “number of samples to capture”. To understand these settings, it helps to know what a sample actually is. A sample is a single recorded value of the signal. At that moment, the logic analyzer simply reads the wire and records whether the signal is HIGH or LOW. Each recorded HIGH or LOW value is one sample. The number of samples tells the logic analyzer how many samples to record in total before stopping. For example, if you set this to 100k, the logic analyzer will record 100,000 values (each value being either HIGH or LOW) and then stop automatically. Increasing this value makes the recording last longer. Decreasing it makes the recording shorter. The sample rate tells the logic analyzer how many samples to take every second. For example, a sample rate of 20 kHz means the logic analyzer records 20,000 samples every second. That means it reads the signal 20,000 times per second and saves each result. A higher sample rate means the signal is read and recorded more frequently. This is important when the signal changes quickly. A lower sample rate means the signal is read less often, which is usually fine for slow signals. From the Manual: The sample rate you choose must at least be twice that of the highest frequency you want to capture - ideally 3 to 5 times as much so that you have some margin. That way, a jittering signal won’t ruin your measurements. These two settings answer two different questions: Together, they decide how long the signal is recorded. PulseView shows this relationship using the capture duration: Suppose you set the sample rate to 20 kHz and the number of samples to 100k. At a 20 kHz sample rate, the logic analyzer records 20,000 samples every second. With 100,000 samples in total, the recording will last for about 5 seconds before stopping. We will use this setting only for our test. It is sufficient here because we are just toggling the GPIO every 500 milliseconds. With the logic analyzer connected and the capture settings configured, we can now start the capture. In PulseView, click Run in the top bar (next to the Session label). The logic analyzer will begin recording samples and will automatically stop once it reaches the configured number of samples. After the capture stops, you should see a waveform on the enabled channel. In our program, the GPIO state is toggled every 500 milliseconds. As shown in the capture, the signal stays HIGH for 500 ms, then LOW for 500 ms, repeating this pattern consistently. Since the total capture duration is 5 seconds, this results in 5 HIGH periods and 5 LOW periods across the entire waveform. Even though the waveform shows only a few visible transitions, the logic analyzer actually recorded all 100,000 samples. Each HIGH or LOW section in the waveform represents many individual samples taken during that time. PulseView automatically zooms out to show the overall shape of the signal rather than displaying every sample at once. If you zoom in horizontally, you will see that each flat HIGH or LOW region is made up of many samples. This confirms that the GPIO toggling, sampling configuration, and capture duration are all working together as expected. In this post, we focused on getting familiar with the logic analyzer and basic signal capture. I am planning to write a follow-up post focused on analyzing I2C signals, and later cover other protocols as well. What is a Logic Analyzer?
Meet the Hardware: 8-Channel USB Logic Analyzer
How a Logic Analyzer Captures Data
Channels
Software Setup
Option 1: PulseView (sigrok, Open Source)
Option 2: Saleae Logic Software (Proprietary)
Toggling a GPIO (Test Signal)
Code snippet
let p = init;
let mut pin = new;
loop
Connecting Pico with Logic Analyzer
Logic Analyzer Raspberry Pi Pico GND GND CH1 GPIO15 Opening PulseView and Detecting the Logic Analyzer
Configuring Sampling Rate and Number of Samples
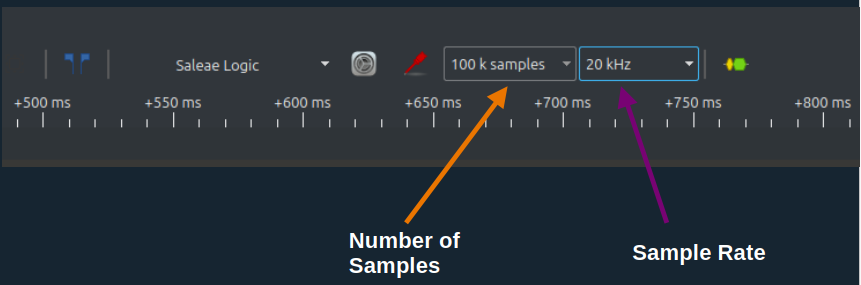
Number of Samples
Sample Rate
How They Work Together
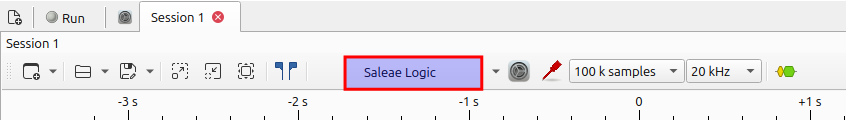
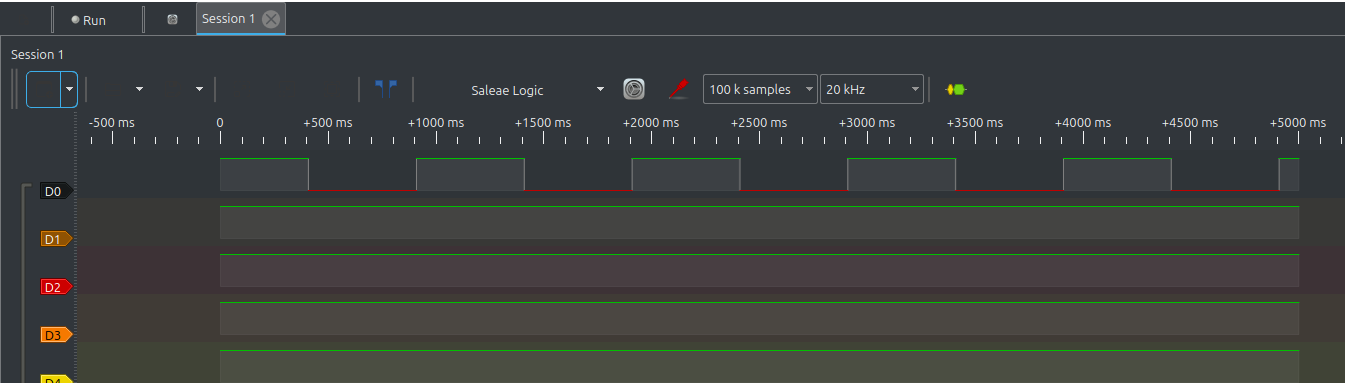
Starting the Capture and Verifying the Signal
What’s Next